The Adirondack Lake Assessment Program (ALAP) celebrates its 20th season this year monitoring the water quality of dozens of lakes and ponds across the Adirondacks. ALAP is a partnership between Protect the Adirondacks and the Adirondack Watershed Institute at Paul Smith’s College. The Adirondack Lake Assessment Program (ALAP) was started in 1998 with three objectives: 1) to organize long-term water quality data on individual lakes and ponds in the Adirondack Park; 2) to provide long-term trend data on individual lakes and ponds for local residents, lake associations, property owners and local governments to help organize water quality protection efforts; and, 3) to assemble a profile of water quality conditions across the Adirondacks. ALAP was designed as a cost-effective program based on trained volunteers and scientific analysis.
Good data and good science help to make good public policy. ALAP has helped to bring good long-term data to the debate over the future of the Adirondack Park.
Map of ALAP lakes in the Adirondack Park in 2015. Water quality data has been gathered on over 100 lakes and ponds throughout the Adirondack Park over the last 20 years.
The Adirondack Watershed Institute designed the ALAP testing program, organized the equipment, trains of volunteers, analyzes the samples using state of the art analyzing equipment and techniques, and writes the annual report. Protect the Adirondacks managed the program and works with volunteers across the Adirondacks.
Here are the ALAP annual reports for 2015 and 2016.
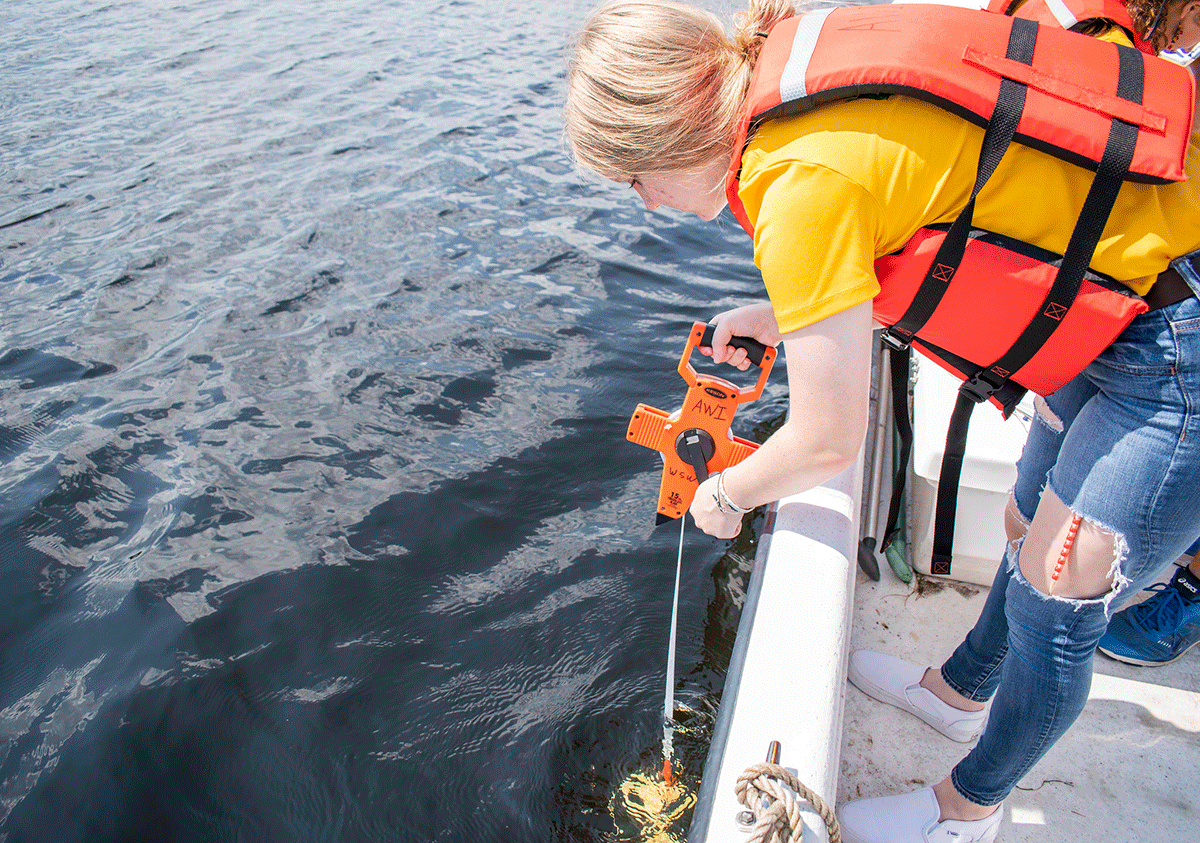
ALAP is driven by volunteers who sample their lakes for 3-month or 5-month sampling seasons. Each month volunteers measure the transparency of their lake with a secchi disk, collect a bottle of water to be analyzed for various chemical components, and filter a small sample of water for chlorophyll. The filter and water sample are kept frozen until they are transported to the laboratory at Paul Smith’s College. Over the past 20 years, ALAP has proved to be one of the best citizen science programs in New York.
The data collected is important for understanding trends in the water quality of the Adirondack Park. For many, the lakes, ponds and rivers are what defines their Adirondack experience. The Park’s generally high water quality underwrites the local economy and quality of life for residents. ALAP data helps local communities, lake associations, lake users, residents and businesses plan for the long-term health of their lake. ALAP data also helps policymakers and Park leaders focus on key challenges facing water quality in the Adirondacks.
ALAP data was recently used by AWI to produce the definitive and comprehensive report on road de-icing (road salt) and was also used in a peer-reviewed study of salt pollution trends in the Adirondack Park. Because ALAP tests primarily developed lakes and ones near roads, our lakes are very susceptible to salt inputs from roads and septic systems and important to the studies.
Maps of ALAP lakes that show degree of impacts. The strength of ALAP is that it monitors a variety of lakes in different areas across the Adirondacks. Some lakes are remote, lightly developed and have few roads in their watersheds, while others are heavily developed with a number of miles of roads. The “trophic status” of lakes is a water quality measurement from high (oligotrophic) to low (eutrophic).
ALAP is a good example of the successful collaboration of two organizations for a common goal. PROTECT, as an environmental and advocacy organization, seeks data that offer definitive proof of whether Adirondack waters are improving or declining. With this data, PROTECT plans to shape public policy to ensure beautiful and healthy water bodies. AWI, as a scientific institution, seeks to build a long-term Adirondack-wide data collection program for research. The partnership has worked very well the last 20 years and we hope it will continue for many more!
ALAP tests for twelve parameters: pH, alkalinity, calcium, the calcium saturation index, transparency, total phosphorus, chlorophyll-a, nitrate, chloride, conductivity, color, and aluminum. With 10 to 19 years of data for most of these lakes, there is now enough information to study other pollution and water characteristic trends besides salt. Here’s more information on the parameters that ALAP tests for:
PH – The pH level is a numeric measurement of acidity (concentration of hydrogen ions in water), that ranges from 1 to 14. On the pH scale, 7 is neutral, lower numbers are more acidic, and higher numbers are more basic. Many aquatic species struggle with growth and reproduction when pH levels fall below 5.5, whereas an acceptable pH level for Adirondack lakes is greater than 6.0
ALKALINITY – Alkalinity (acid neutralizing capacity) is a measure of the buffering capacity of water, and in lake ecosystems refers to the ability of a lake to absorb or withstand acidic inputs. In the northeast, most lakes have low alkalinities, which mean they are sensitive to the effects of acid rain.
CALCIUM – Calcium is a naturally occurring buffering material. However, it is often in short supply in Adirondack lakes and ponds, making them susceptible to acidification by acid rain.
CALICITE SATURATION INDEX – The Calcite Saturation Index (CSI) is another method used to determine the sensitivity of a lake to acidification. High CSI values indicate increasing sensitivity to acidic inputs.
TOTAL PHOSPHORUS – Phosphorus is one of the essential nutrients for life, and in northeastern lakes, is often the controlling or limiting nutrient in lake productivity. Total phosphorus measures all forms of phosphorous, both organic and inorganic, and its levels are directly related to the trophic status (water quality conditions) of a lake.
CHLOROPHYLL-A – Chlorophyll-a is the green pigment in plants used for photosynthesis, and measuring it provides information on the amount of algae in lakes.
SECCHI DISK TRANSPARENCY – The Secchi Disk is a tool used to measure the clarity of water in lakes and ponds. It is determined by lowering the 20cm black and white disk (Secchi) into a lake to the depth where it is no longer visible from the surface.
NITRATE – Nitrogen, along with Phosphorus, is another one of the essential nutrients for life. Nitrate is the inorganic form of nitrogen, and occurs naturally in the environment. In excess of its natural production, however, it is an atmospheric pollutant. Elevated levels of nitrate concentrations may be indicative of lake acidification or wastewater pollution.
CHLORIDE – Chloride is an anion (negatively charged ion) that occurs naturally in surface waters, and typically in low concentrations (usually less than 1 ppm). Chloride above typical levels in Adirondack lakes (often caused by winter road de-icing, faulty septic systems, etc.) can alter the distribution and abundance of aquatic plant and animal species.
CONDUCTIVITY – Conductivity is the measurement of water’s ability to conduct electric currents, and will increase as dissolved minerals build up within a water body. Some high conductivity values are naturally occurring, while others may be indicative of pollution by road salt runoff or faulty septic systems.
COLOR – The measurement of color is usually used in lake classification to describe the degree to which the water body is stained due to the accumulation of organic acids. The color is affected by both dissolved material (metallic ions, organic acids) and suspended materials (silt and plant pigmentations).
ALUMINUM – Aluminum is one of the most abundant elements found within the earth’s crust. Dependent on the acidic level and composition of a water body, certain types of aluminum can bond with dissolved organic carbon, and can be potentially harmful or fatal to aquatic fauna.
For more information about ALAP or to enroll a lake in this monitoring program click here.


